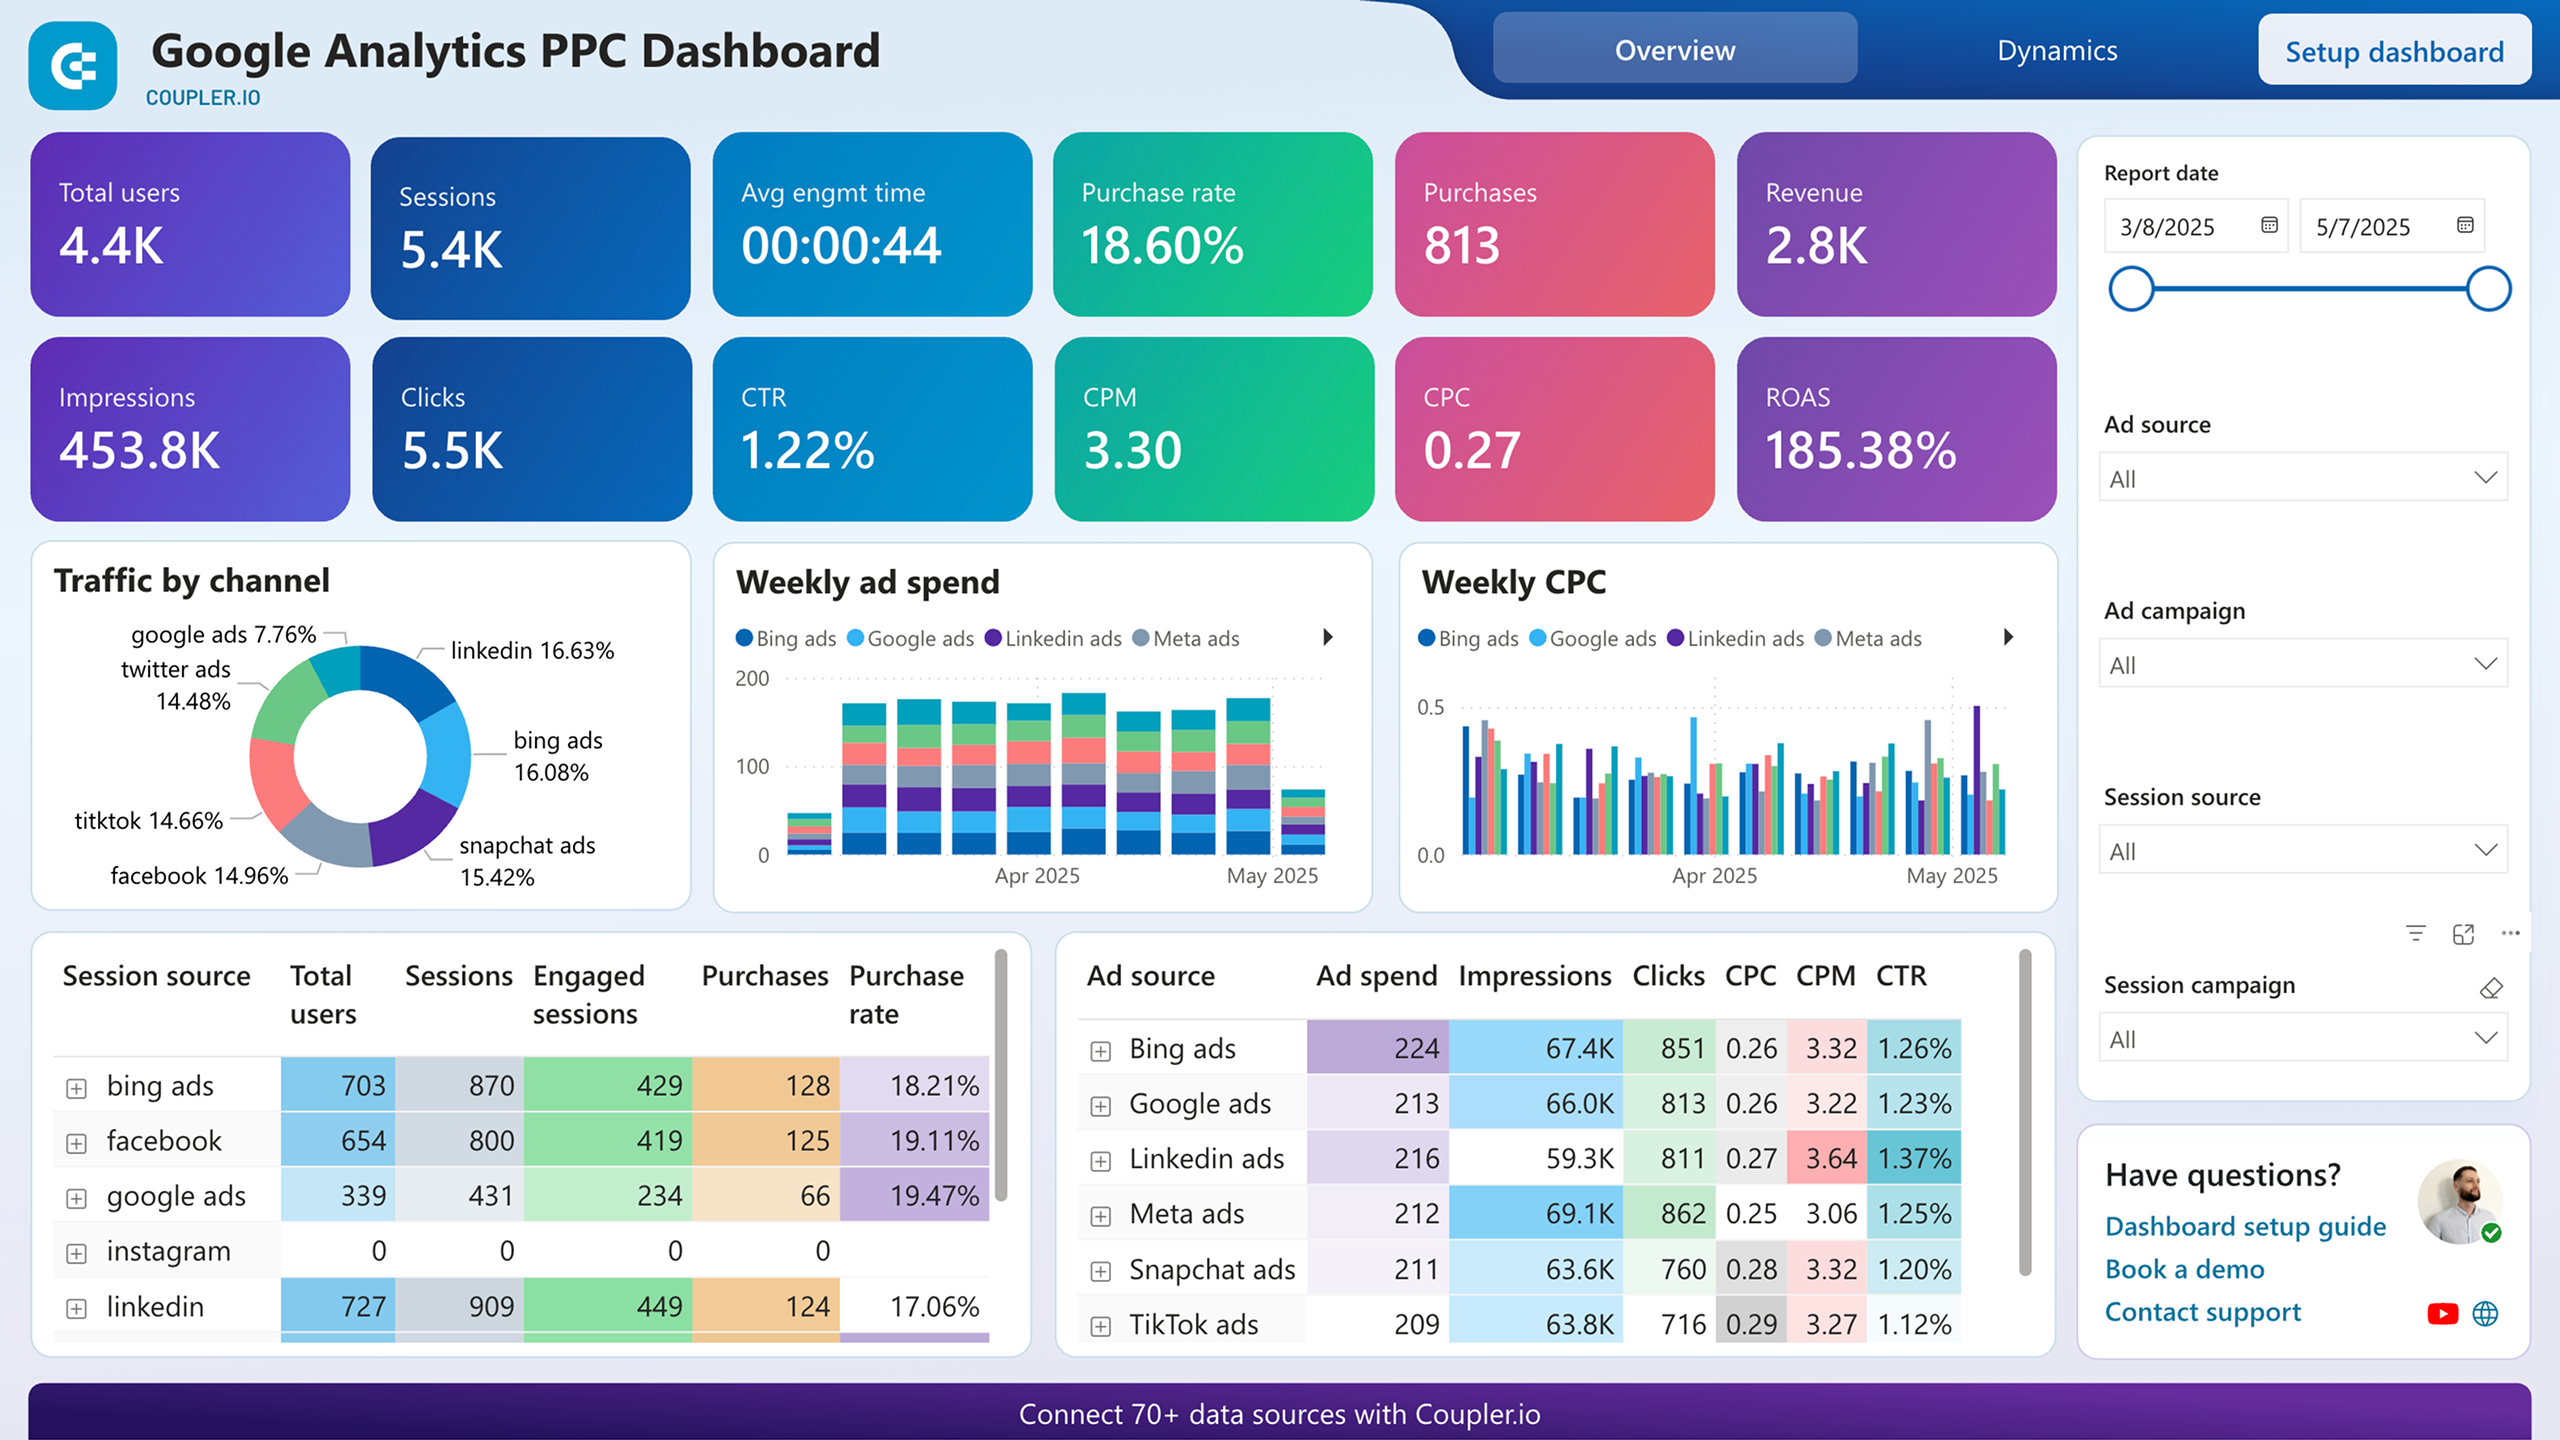
Power BI Course Curriculum
Power BI is a powerful business intelligence and data visualization tool that helps transform raw data into meaningful insights through interactive dashboards and reports. It enables users to analyze data, track key performance indicators, and make smarter, data-driven decisions.
1. Introduction to Power BI
- Understanding Business Intelligence and Data Analytics
- Overview of Power BI and its components
- Power BI Desktop, Service and Mobile
- Understanding the Power BI workflow
- Connecting data to business insights
2. Data Sources and Data Connectivity
- Connecting Power BI with Excel and CSV files
- Working with SQL Server databases
- Connecting to web and cloud-based data sources
- Import Mode vs DirectQuery
- Understanding data refresh and connectivity
3. Data Cleaning with Power Query
- Introduction to Power Query Editor
- Cleaning and transforming raw data
- Handling missing and duplicate values
- Splitting and merging columns
- Changing data types and formats
- Combining multiple datasets
4. Data Modeling
- Understanding tables and relationships
- Creating one-to-one and one-to-many relationships
- Working with fact and dimension tables
- Introduction to Star Schema
- Creating efficient data models
- Managing relationships between datasets
5. DAX Programming
- Introduction to Data Analysis Expressions (DAX)
- Creating calculated columns
- Creating measures and KPIs
- Working with aggregation functions
- Using logical and conditional functions
- Time intelligence calculations
- Understanding filter and row context
6. Data Visualization and Reports
- Creating interactive charts and graphs
- Working with tables and matrices
- Using cards, KPIs and gauges
- Creating slicers and filters
- Applying drill-down and drill-through features
- Designing professional business reports
7. Interactive Dashboards
- Building dynamic Power BI dashboards
- Creating interactive report pages
- Using bookmarks and buttons
- Implementing report navigation
- Creating business performance dashboards
- Improving dashboard usability and design
8. Advanced Power BI Features
- Advanced DAX calculations
- Hierarchies and drill-down analysis
- Conditional formatting
- Custom visuals
- Tooltips and interactive reporting
- Performance optimization techniques
9. Power BI Service and Deployment
- Publishing reports to Power BI Service
- Creating and managing workspaces
- Sharing reports and dashboards
- Managing user access and permissions
- Configuring scheduled data refresh
- Understanding Power BI Apps
10. SQL and Power BI Integration
- Connecting Power BI with SQL databases
- Importing data using SQL queries
- Working with joins and relationships
- Creating reports from database tables
- Optimizing data retrieval for reporting
- Practical database reporting scenarios
11. Real-Time and Business Analytics
- Understanding real-time data concepts
- Creating business performance reports
- Sales and revenue analysis
- Customer and operational analytics
- Financial reporting dashboards
- IT and project performance reporting
12. Power BI Projects and Practical Training
- End-to-end dashboard development
- Sales Analytics Dashboard
- HR Analytics Dashboard
- Financial Performance Dashboard
- Customer Analysis Dashboard
- Real-world IT industry projects
- Portfolio and project presentation